
Insights
Manufacturing Bottleneck Analysis and Capacity Planning: 101
Get practical tips on manufacturing bottleneck analysis and capacity planning to improve production flow, reduce delays, and make smarter business decisions.
By Private Capital Group ·
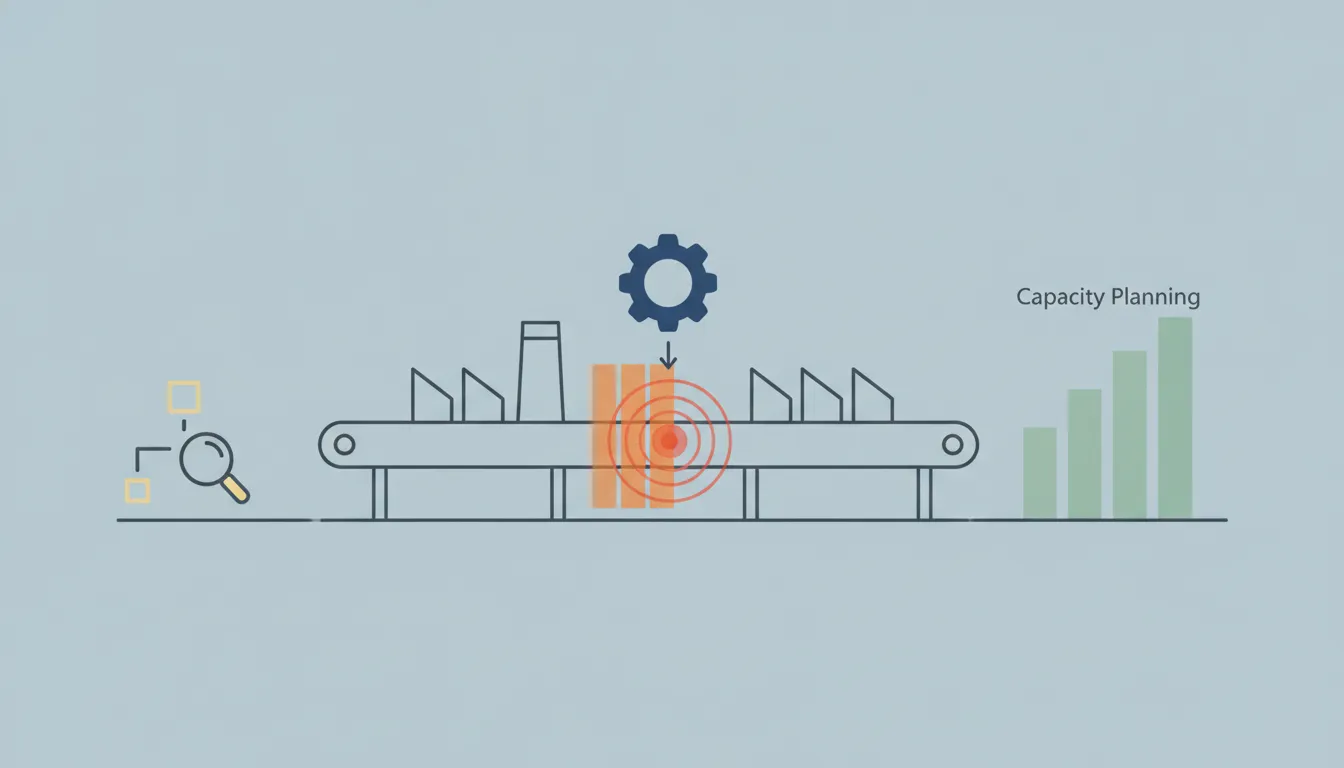
A production line can look busy from end to end and still fall behind. Work may pile up before one machine, while employees and equipment elsewhere wait for the next step. That constraint can stretch lead times, increase overtime, tie up cash in unfinished goods, and put customer commitments at risk. The first challenge is finding the real cause. A long queue does not always mean the station in front of it is the bottleneck; a material shortage, quality issue, or staffing gap may be responsible. Manufacturing bottleneck analysis and capacity planning help leaders trace these delays, compare actual output with available resources, and choose practical changes based on what the operation needs.
Key Takeaways
- Trace the production flow to find the constraint: Compare output, cycle times, downtime, and WIP across steps, then validate recurring delays with the people doing the work.
- Match production plans to real demand and resources: Coordinate forecasts, product mix, labor, materials, and equipment across sales, operations, and production.
- Review operational and financial effects before investing: Measure whether changes improve finished output without harming quality, delivery, cash flow, or margins.
What Is a Manufacturing Bottleneck—and Why Does It Matter?
See how constraints limit throughput, extend lead times, and raise costs
A manufacturing bottleneck is a step whose available capacity cannot keep pace with the work it receives. Since production steps depend on one another, that constraint can cap the number of finished products the entire operation can deliver. Increasing output elsewhere may only create a larger queue of unfinished work before the constrained step.
The impact reaches beyond the shop floor. Longer queues can extend lead times, make delivery commitments harder to meet, and add costs through overtime, excess inventory, or idle labor. Poor capacity planning can also contribute to downtime and lost sales, while sound planning helps align resources with production needs, as Deskera’s guide to manufacturing capacity planning explains. For business leaders, recurring delays may affect margins, customer relationships, and cash flow.
Spot warning signs: growing WIP, missed schedules, uneven output, and idle downstream stations
Look for patterns rather than reacting to a single late order. Work in progress (WIP) may pile up before one machine or process while downstream stations wait for parts. Production may repeatedly fall behind schedule, or output may vary between shifts even when staffing and demand are similar. Together, these signs can point to uneven flow through the operation.
One symptom alone does not confirm a bottleneck. A breakdown, material shortage, quality issue, or inaccurate production record can cause a temporary delay. Compare WIP, output, downtime, and schedule performance over time, and check whether the same step keeps causing disruption. Capacity analysis can help identify issues such as changeovers, breakdowns, and material shortages, giving managers a clearer starting point for investigation.
Check whether the busiest workstation is the true bottleneck
The workstation with the longest queue or highest utilization may seem like the obvious constraint, but activity alone does not tell the whole story. A station may appear busy because it processes large batches, handles rework, or receives work unevenly. Another step may be less visible yet still limit how quickly finished products leave the line.
Compare each step’s available capacity with the work arriving, and track cycle times, downtime, queues, and handoffs across shifts. Ask operators and supervisors what interrupts production and whether the pattern is recurring. Regular capacity analysis can help distinguish a persistent constraint from a temporary disruption. Since operational changes can affect costs, staffing, and cash needs, a whole-business assessment can also help leaders consider production decisions alongside the company’s broader financial and operational priorities.
How Do You Analyze Production to Find Bottlenecks?
Finding a production bottleneck takes more than identifying the busiest machine. The constraint could be a slow process, a material shortage, a lengthy approval, or a handoff that leaves work waiting. To find it, trace production from order release to finished goods, then look for recurring delays, capacity limits, and quality issues.
Use data from multiple shifts or production runs, and check it against what employees see on the floor. A manufacturing capacity analysis can help compare potential output with actual results and reveal where lost time or other issues reduce capacity. Once you identify a likely constraint, focus on its causes before changing staffing, schedules, or equipment.
Map the full production flow, including queues and handoffs
Trace each product’s path from incoming materials to shipment. Include every process step, inspection, staging area, queue, and handoff between teams. A flow map can reveal that work spends more time waiting between stations than being processed.
For each step, note who owns the work, what must be available before it starts, and where completed items go next. Mark where jobs wait for materials, instructions, equipment, quality approval, or a worker with a specific skill. Then ask operators to review the map. Their input can uncover workarounds and exceptions that formal process documents miss. This shared view helps the team decide where to collect more detailed measurements.
Measure cycle time, throughput, downtime, and WIP at each step
Collect consistent measures at every major workstation. Cycle time shows how long a task takes; throughput counts how many units move through in a set period. Downtime records when equipment or work is unavailable, while work in process (WIP) counts units that are being handled or waiting but are not yet finished.
Compare stations under similar conditions, such as the same product mix and shift length. Record the reason for delays, too. Low output might reflect a material shortage rather than slow machine performance. Capacity depends on both output rate and productive hours, so tracking downtime and productive time helps explain why actual results may fall short of expectations.
Compare actual and planned output to find recurring constraints
Compare actual output with the production plan by product, workstation, shift, and time period. One missed target may result from an unusual disruption. Repeated shortfalls at the same step suggest a constraint worth investigating. Check whether the plan assumes realistic product mix, staffing, material availability, and operating hours.
Look for a queue that keeps growing before one station, downstream workers waiting for work, or orders that repeatedly miss their scheduled completion dates. High utilization alone does not prove a station is the bottleneck. A regular comparison of planned and actual output helps show which step limits total throughput, so improvement work can target the cause instead of simply increasing activity elsewhere.
Validate production data with operators, supervisors, and shop-floor observations
Production records provide a starting point, but they may not explain why delays happen. Review machine data, shift reports, downtime logs, and timed observations with operators and supervisors. Ask whether recorded downtime matches their experience and whether setup work, product variation, or quality checks affect the results.
Observe the process across different shifts and production runs. A machine may appear available in a system while waiting for an operator, tooling, or quality clearance. Collect information over multiple periods to separate normal patterns from one-off events. This review improves data quality and helps the team select changes that fit the real workflow. It also gives the people closest to the work a role in shaping practical improvements.
Distinguish persistent bottlenecks from temporary disruptions
A persistent bottleneck repeatedly limits production flow. A temporary disruption, such as a breakdown, late delivery, or unexpected absence, causes a short-lived delay. Compare results across several periods and watch for the station where queues and missed output keep returning.
Before changing staffing or buying equipment, investigate whether the constraint stems from recurring downtime, changeovers, defects, limited skills, or inconsistent material supply. Increasing output at other stations may only add WIP ahead of the bottleneck. Address the recurring constraint first, then measure the flow again to see whether the limiting step has shifted. When causes span departments, coordinated operational improvement support can help connect the analysis to execution.
Which Tools and KPIs Help You Analyze Capacity?
Capacity analysis is most useful when it connects what customers have ordered with what your operation can produce. A schedule may show that a line is full, but it won’t explain whether the constraint is a shortage of materials, a staffing gap, long changeovers, or equipment downtime. To understand the cause, bring together information about orders, inventory, labor, production schedules, and shop-floor performance.
Start with the systems and records your team already uses. ERP or MRP reports, maintenance logs, production schedules, and operator feedback can all help identify where work slows down. The aim is not to collect every possible metric. It is to build a reliable picture of how work moves through the business and where available time, people, or equipment are limiting output. Manufacturing capacity planning tools can help connect these operational details.
Choose KPIs that support decisions, then review them together. High utilization, for example, may look favorable until you see that WIP and lead times are rising. Check whether the data matches what employees observe on the floor, and examine results by work center, product, or shift. This helps distinguish a recurring constraint from a temporary disruption or a problem with the data itself.
Connect orders, materials, labor, and schedules with ERP and MRP systems
Enterprise resource planning (ERP) and material requirements planning (MRP) systems can bring order details, inventory, purchasing, labor plans, and production schedules into a shared view. Planners can use this information to check whether the people and materials required for upcoming work will be available when needed. It can also surface conflicts, such as two orders requiring the same limited components or production hours.
The system is only as useful as its inputs. Outdated inventory counts or incomplete labor information can create a plan that looks workable but cannot be carried out. Review how data moves between systems, who updates it, and how often it is checked against shop-floor conditions. Reliable ERP and MRP data helps teams coordinate production decisions and spot potential capacity gaps earlier.
Use MES, OEE dashboards, and downtime logs to track shop-floor performance
A manufacturing execution system (MES) can record activity as work moves through the production floor. Combined with an overall equipment effectiveness (OEE) dashboard and downtime logs, it can show when equipment is running, how quickly it produces, and how much output meets quality standards. These records give managers a clearer view of actual production time than estimates alone.
Separate planned downtime from unplanned stoppages, and account for maintenance, changeovers, breaks, and other non-production time when assessing available capacity. Then ask operators and supervisors to review unusual readings. A machine recorded as running, for instance, may be waiting for materials or adjustments. Matching system data with employee observations helps identify the reasons behind lost time and decide what to address first.
Test scenarios with advanced planning, scheduling, or simulation tools
Advanced planning and scheduling tools help teams compare a production plan with real operating limits, including equipment availability, labor skills, order priorities, and material arrival dates. Simulation software can model possible changes before the business commits resources. A manufacturer might test whether adding a shift, changing batch sizes, or moving work to another line would improve output or create new delays.
Use scenario planning to answer specific questions, rather than treating one forecast as certain. Compare different demand levels and supply conditions, then assess their likely effects on throughput, lead times, and resource needs. Capacity planning scenarios can reveal trade-offs early, but their value depends on realistic assumptions. Check those assumptions with production teams and update them when orders, staffing, or supplier timelines change.
Track utilization, throughput, downtime, lead time, WIP, schedule attainment, and defects
A balanced KPI set shows how much capacity you use and how effectively it turns into customer-ready output. Utilization measures the share of available equipment or labor time spent working. Throughput tracks completed units over a period, while lead time measures how long an order takes to move through production. Work in process (WIP) is the unfinished work waiting between production steps.
Add downtime, schedule attainment, and defect rates to understand the causes and impact of delays. High utilization alongside rising WIP and longer lead times may indicate work is accumulating at a constraint. Strong output paired with more defects can signal that production is coming at a quality cost. Review measures together and compare results by product, shift, and work center so facility-wide averages do not hide local issues.
Choose tools that fit your workflows, data quality, and planning needs
The right tool is one your team can maintain and use to make better decisions. A smaller manufacturer may get useful insight from accurate schedules, downtime records, and a well-managed ERP system. An operation with multiple lines, complex products, or changing demand may need MES, advanced scheduling, or simulation software. Begin by identifying the decisions you need to support, then choose tools that fit those needs and your workflows.
Before adding software, check data quality and ownership. Disconnected systems, inconsistent definitions, and delayed updates can make capacity estimates unreliable, regardless of how polished a dashboard looks. Set clear standards for measures such as downtime and throughput, and assign responsibility for keeping records current. If addressing a capacity gap could affect cash flow or require new investment, include those considerations in the plan. Private Capital Group’s business advisory and capital support can help leaders assess operational and financial needs together.
How Do Design, Effective, and Actual Capacity Differ?
Design, effective, and actual capacity describe different levels of production output. Design capacity is the theoretical maximum a facility could produce under ideal conditions. Effective capacity accounts for planned limits, such as scheduled maintenance, breaks, and shift changes. Actual capacity measures what the operation produces after both planned and unexpected losses.
Consider a line with a design capacity of 1,000 units per shift. If planned maintenance and changeovers reduce its effective capacity to 800 units, that is a more useful starting point for production planning. If the line regularly produces only 650 good units, the gap between effective and actual capacity signals a need to investigate.
Use all three figures to understand what the operation could produce, what it can reasonably plan to produce, and what it delivers today. A facility-wide average alone may hide a constraint at one station or differences between products. The manufacturing capacity analysis guide outlines how planned and unexpected losses affect capacity. Pair those figures with information on labor, materials, costs, and demand before changing schedules or considering a capital investment.
Compare theoretical design capacity with effective capacity after planned losses
Design capacity represents the maximum output a facility could reach under ideal conditions. It assumes equipment runs at its intended speed and production has the people, materials, and time it needs. That makes design capacity a useful benchmark, but it is rarely a realistic daily target.
Effective capacity adjusts that benchmark for planned limits. These may include maintenance, breaks, cleaning, shift handoffs, and scheduled changeovers. If a line could theoretically produce 1,000 units per shift but planned activities leave time for only 800, its effective capacity is 800 units.
Use effective capacity to build schedules and set delivery expectations. Then compare actual results with that practical target to identify where production is falling short. Capacity analysis helps distinguish a system’s theoretical ceiling from the output it can sustain under normal conditions.
Measure actual output against available labor, equipment, materials, and production time
Actual capacity is the output a facility achieves under real operating conditions. It reflects disruptions such as equipment failures, material shortages, defects, staffing gaps, and human error. Because it captures these conditions, actual capacity is the clearest measure of what the operation can deliver today.
Track good units completed over a consistent period, such as a shift, day, or week. Record production time, downtime, staffing, material availability, and output at each step. Compare the results with effective capacity, not only with the theoretical design figure. If actual production repeatedly falls short, identify when and where the loss occurs before changing the schedule or committing to equipment.
Keep measurements specific to products and production steps where possible. Facility-wide totals can conceal differences in product mix and cycle time. Check production records against shop-floor observations and operator feedback to confirm the data reflects how work moves through the process.
Account for changeovers, maintenance, rework, staffing gaps, and process variation
The difference between effective and actual capacity often comes from losses that vary by shift, product, or week. Changeovers may take longer than planned, maintenance may run over, and rework can use production time without creating sellable output. Absences or skill gaps may also leave equipment idle while teams wait for qualified operators.
Track each loss by type, duration, location, and frequency instead of labeling everything as downtime. This makes recurring patterns easier to spot. For example, repeated delays after a product changeover may point to a setup process that needs attention, while frequent short equipment stops may call for a maintenance review.
Process variation matters as well. Cycle times can fluctuate even when staffing and equipment appear available, making output harder to predict. Review performance across multiple shifts and product runs, then use the findings to refine schedules, maintenance routines, or cross-training.
Assess capacity at the constraint, not through facility-wide averages
A production system’s output is limited by its most constrained step, often called the bottleneck. Facility-wide averages can hide that point. Faster stations may keep producing work that the bottleneck cannot process, creating queues while downstream equipment waits.
Measure cycle time, downtime, queue size, and output at each step. Look for work piling up before one station or idle time after it. Check these patterns with operators and supervisors, since product mix, staffing changes, or a temporary equipment issue can affect which step limits flow.
Focus improvement efforts on the current constraint. Raising output elsewhere may only add work in progress without increasing finished goods. After making a change, measure the flow again because another step may become the constraint. For leaders weighing operational changes alongside cash flow and capital needs, Private Capital Group’s business advisory support connects business priorities with coordinated planning and execution.
How Do Demand Forecasts Guide Capacity Planning?
Convert forecasts and product mix into labor, equipment, material, and time requirements
A demand forecast becomes useful for capacity planning when you translate expected orders into the work required to fulfill them. Start with forecast volume by product, then use production routings and cycle times to estimate the labor hours, machine time, materials, and facility space each product will need.
Product mix matters as much as total volume. Producing 1,000 units may be straightforward if they use the same process, but more challenging if they require different machines, skills, or changeovers. Compare the requirements with available capacity at each production step to find where demand may exceed what your team can deliver. Manufacturing capacity planning guidance offers a useful framework for comparing resource needs with production capacity. This turns a sales target into a practical view of what daily and weekly production will require.
Align sales, operations, and production around shared assumptions
Capacity plans work best when sales, operations, and production work from the same assumptions. Sales may understand customer expectations and likely orders; operations can flag supplier or staffing limits; production teams know actual cycle times, downtime, and changeover requirements. Bring these perspectives together before finalizing a plan.
Agree on the forecast period, expected product mix, confirmed orders, and assumptions about labor, materials, and equipment availability. Make clear which orders are firm and which remain uncertain. This helps prevent teams from planning around different versions of demand, then scrambling when production cannot meet a commitment. Keep assumptions visible and give teams a clear way to flag changes. For companies managing operational pressure across departments, a coordinated approach to business challenges can help connect decisions and execution.
Model demand scenarios, lead times, and capacity gaps before setting delivery dates
A single forecast cannot account for every possible outcome. Build a few practical scenarios, such as expected demand, a surge in orders, and a slower period. For each, compare required capacity with available labor, machine time, materials, and supplier lead times. This shows where shortfalls may arise and how much flexibility the plan has.
Check each production step rather than relying on a facility-wide average. A line may have enough total hours but still fall behind if one workstation cannot keep pace. Test options such as overtime, resequencing jobs, adding a shift, or using a qualified outside supplier, then consider the cost and timing of each. Capacity analysis methods can help identify constraints across production steps. Use the results to set realistic delivery dates and communicate risks before they affect customer commitments.
Refresh forecasts with order patterns, market signals, and reliable production data
Treat the forecast as a working plan, not a fixed number. Update it as orders arrive, customers change timing, sales patterns shift, or suppliers report longer lead times. Compare forecast demand with actual orders and shipments to identify recurring gaps. If one product regularly sells above expectations while another slows, adjust the product mix in your capacity calculations.
Ground those updates in reliable production data. Current cycle times, downtime, scrap, staffing, and work-in-progress levels help show what the business can realistically produce. If reports are incomplete or delayed, ask supervisors and operators to check the data before changing schedules or promising delivery dates. Regular reviews help teams use resources effectively, control costs, and respond to changing demand, outcomes emphasized in manufacturing capacity planning guidance.
What Challenges Arise When You Balance Capacity With Demand?
Capacity planning means making decisions with imperfect information. Orders can shift, suppliers can run late, and production data may not reflect what is happening on the floor. A change that solves one problem can create another: extra inventory ties up cash, while pushing equipment harder can increase maintenance needs.
The aim is to meet demand reliably without losing sight of cost, quality, and the people and equipment your operation depends on. These challenges can help you spot where your plan needs more flexibility.
Plan for forecast error, demand variability, and product-mix shifts
A forecast is a planning tool, not a guarantee. If demand exceeds expectations, you may face overtime, late orders, or shortages. If it falls short, you may have unused capacity and inventory that takes time to sell. Product mix matters, too: two products with similar sales volumes can require very different labor hours, equipment, or production steps.
Build plans around a few realistic demand scenarios rather than a single prediction. Review order patterns and product mix regularly, then assess how each scenario affects staffing, materials, and machine time. Manufacturing capacity planning guidance recommends flexible production strategies to help companies respond when forecasts miss the mark. Revisit assumptions before committing to schedules and delivery dates, especially when demand changes often.
Address inconsistent data and disconnected planning systems
Capacity decisions are only as reliable as the information behind them. If forecasts, inventory records, labor schedules, and production reports don’t align, teams may plan from different versions of the facts. A machine might appear available in one system even though it needs maintenance, or a schedule may assume materials will arrive before a supplier has confirmed shipment.
Agree on which data sources teams will use and who is responsible for keeping them current. Compare system reports with shop-floor observations, and investigate recurring gaps. Disconnected or poor-quality data can make capacity estimates less reliable, as Deskera’s capacity planning overview explains. Coordination across sales, operations, purchasing, and production helps teams work from shared assumptions and identify planning issues sooner.
Account for labor shortages, skill gaps, supplier delays, and complex operations
Available machine hours don’t tell the whole story. A line may have open time but lack trained operators for a specialized task. A supplier delay can leave employees and equipment waiting, while a complex sequence of handoffs can slow output even when each station appears adequately staffed.
Map the resources each product requires, including skills, materials, equipment, and approvals. Identify where a shortage or delay could interrupt the full workflow. Cross-training may help cover absences or peak periods, while clearer supplier communication can give planners more time to adjust. Before adding people or shifts, check whether work is regularly waiting between steps. The issue may lie in coordination or process design. Supervisors and operators can help validate plans against the realities of production.
Weigh excess capacity and inventory against missed orders and delivery risks
Extra capacity or inventory can provide a buffer when demand rises or materials arrive late. But buffers have a cost: idle equipment, storage expenses, and cash tied up in materials or finished goods. Planning too tightly carries its own risks, including missed orders, rushed production, and unreliable delivery dates.
Compare the cost of a buffer with the likely impact of a shortage. Consider which products matter most to customers, how long replenishment takes, and how quickly production can adjust. You might reserve capacity for urgent orders or hold extra stock for materials with long lead times instead of applying the same buffer across the board. Capacity decisions also affect cash flow and capital needs. Private Capital Group’s business advisory services address operational and financial pressures together, helping leaders assess trade-offs before committing resources.
Avoid maximizing output at the expense of quality, maintenance, or workforce sustainability
Running every machine and team at full pace may appear efficient, but it can leave little room for maintenance, training, or unexpected work. Delayed service can contribute to breakdowns, while sustained overtime can increase fatigue and errors. If defects and rework rise along with output, more production may not mean more finished goods ready for customers.
Set capacity targets that account for maintenance, realistic staffing, and quality checks. Track completed output, not just machine activity, to see whether higher utilization is producing useful results. When a constraint is under pressure, look for ways to reduce setup time, downtime, or rework before asking employees to maintain a faster pace. Milliken’s capacity-planning guidance emphasizes using resources efficiently without compromising quality, maintenance, or workforce sustainability.
How Can You Relieve Manufacturing Bottlenecks?
Relieving a bottleneck means improving the step that limits production, not simply asking every station to work faster. Start with the production data and shop-floor observations, then test focused changes and track their effect on completed output. A useful improvement should ease the constraint without creating new queues, quality issues, or unsustainable demands on workers.
Prioritize the constraint to improve total system throughput
Identify which step repeatedly limits the number of finished products your operation can deliver. Compare cycle times, downtime, queue sizes, and output across the production flow, then confirm what you see with operators and supervisors. The busiest station is not automatically the bottleneck. Another step may be the one that holds up orders, even if its employees or equipment appear less occupied.
Focus first on the confirmed constraint. Depending on what is causing the delay, you might resolve an equipment problem, prepare materials earlier, or change the sequence of work. Increasing output at other stations can create more work-in-progress without improving total production. A manufacturing capacity analysis can help pinpoint where capacity is limiting the flow.
Reallocate labor, equipment, and work without creating queues elsewhere
Once you know where work is getting stuck, consider whether a targeted shift in resources could help. You might assign a qualified operator to the constrained station, move compatible jobs to an available machine, or sequence orders to reduce waiting and setup time. Before making changes, check capacity at the steps before and after the constraint. A station that cannot absorb additional work may simply become the next source of delays.
Track the results by reviewing completed units, wait times, and work-in-progress across the flow. Ask employees who perform the work where they see avoidable handoffs, material delays, or setup tasks. Their observations can explain patterns that production reports alone may not reveal. A structured capacity review can support decisions about where labor and equipment will have the most effect.
Reduce breakdowns, slow cycles, changeovers, idle time, defects, and startup delays
Lost production time is not limited to major equipment failures. Slow cycles, short stops, lengthy changeovers, idle periods, defects, and delays during startup can also reduce output. Review downtime logs and quality records to see which losses occur most often, how long they last, and whether they affect the constrained station. This gives your team a clearer starting point than trying to fix every issue at once.
Then address recurring causes with practical changes. Standard setup procedures may shorten changeovers, while clearer work instructions can help reduce mistakes and rework. If equipment stops frequently, investigate maintenance needs, operator training, and material quality. These categories align with the six common production losses, a useful checklist for finding where time and capacity are slipping away.
Improve preventive maintenance, scheduling, cross-training, and shift coverage
Plan routine maintenance before equipment problems interrupt production. Use service records and operator feedback to schedule checks at intervals that protect reliability while accounting for order commitments. Build realistic production schedules, too. Compare planned work with actual cycle and setup times, and account for breaks, staffing, and other demands on available production time.
Cross-training can give supervisors more flexibility when employees are absent or demand shifts between work areas. It can also help reduce reliance on a single person with a specialized skill. Review shift coverage alongside the production schedule, especially at constrained stations with limited qualified staff. Capacity planning guidance recommends tracking actual work time and cross-training employees to improve flexibility.
Use practical buffers and order priorities when demand or supply is uncertain
When customer demand or supplier lead times vary, a measured buffer can protect production from disruption. Depending on the situation, that may mean reserving time in the schedule, keeping safety stock of a critical component, or holding capacity for urgent work. Set clear limits and review them regularly. Too much inventory can tie up cash and storage space, while too little may leave a constrained station waiting for materials.
Set consistent rules for deciding which orders take priority when capacity is tight. Agree on criteria with sales, operations, and production, such as delivery commitments, material availability, or customer requirements. Revisit the rules when conditions change, rather than relying on informal requests. Capacity planning guidance recommends allowing for disruptions such as supply delays, equipment breakdowns, and demand swings.
Consider outsourcing or targeted capital investment when internal capacity falls short
If scheduling changes and process improvements do not resolve a persistent capacity gap, compare options such as outsourcing a production step, adding a shift, or purchasing equipment. Use demand forecasts, production routings, supplier lead times, and realistic operating assumptions to estimate how much added capacity you need. Outsourcing may help address a near-term constraint, while an equipment purchase may suit a steady demand pattern.
Consider more than the purchase price. Assess how each option could affect quality, delivery, cash flow, debt, and other production steps. New equipment can shift the bottleneck rather than remove it, so review the full process before committing capital. Private Capital Group’s business advisory and capital solutions can help company leaders assess operational needs alongside financing and execution considerations.
How Can You Sustain Capacity Planning?
Capacity planning is most effective as an ongoing management process, not a one-time response to a production problem. Demand, production performance, staffing, supplier reliability, and available cash all affect how much a business can deliver. Reviewing these factors together helps leaders spot changes early and choose a response that fits the whole operation.
Set a regular planning rhythm, but adjust it to your business. A team with long equipment lead times or extended hiring and training needs may need to look further ahead than a business that can change schedules quickly. Use short-term reviews to manage current orders and longer-term discussions to consider hiring, facility changes, or capital spending.
Keep the plan practical. Give each action an owner, set a date to review progress, and check whether changes improve output without causing problems elsewhere. A plan that accounts for customer demand, operational constraints, and financial resources is more likely to hold up as conditions change.
Review forecasts, constraints, and capacity plans regularly
Schedule recurring reviews of demand forecasts, production schedules, and the constraints limiting output. The right cadence depends on how long it takes to hire and train staff, source equipment, or expand facilities. A sales and operations planning review can help sales, operations, and finance align around shared assumptions and a planning horizon that fits those lead times.
Compare forecasts with incoming orders and actual production results. If demand or product mix shifts, update labor, materials, and equipment plans before the change leads to missed delivery dates. Use a short-term view for scheduling and a longer-term view for decisions such as hiring or investment. Record what changed, who will take action, and when the team will review the plan again.
Use lean methods and continuous improvement to address recurring losses
When the same constraint appears repeatedly, look for the work causing it rather than simply asking employees to produce faster. Check for avoidable downtime, long changeovers, excess movement, rework, material delays, and uneven workloads. Lean methods can help teams identify waste and test practical changes, such as standardizing a setup or improving how materials reach the line.
Start with a specific issue and a measurable goal, then involve the operators who know the process firsthand. A manufacturing capacity analysis can help identify the constraint limiting total output and target improvement where it matters most. After a change, check whether throughput improved without increasing defects, overtime, or queues elsewhere. If the losses return, revisit the process and adjust the standard work.
Track throughput, lead times, utilization, quality, WIP, and costs against targets
Choose a focused set of measures that shows production performance and its effect on customers and costs. Track throughput, lead time, machine utilization, downtime, work in process (WIP), schedule attainment, defects, and overtime. Compare results with clear targets and review trends over time instead of reacting to a single shift or unusually large order. These measures can help teams assess manufacturing capacity and spot recurring problems.
Define each metric consistently so teams are comparing the same information. Agree, for example, on how to calculate downtime and when lead time begins. Assign someone to maintain the data, and ask shop-floor teams to help explain unexpected results. A dashboard is useful when it supports a decision: where to investigate, what to change, and how to tell whether the change worked.
Assess cash flow, debt, and capital needs before making operational changes
Operational changes can require cash well before they deliver savings or additional revenue. Before adding a shift, hiring, buying equipment, or outsourcing work, estimate the full cost and timing. Include training, maintenance, materials, freight, financing, and the working capital needed to carry inventory or cover customer payment cycles. Compare these costs with realistic demand and the likely effect on throughput, delivery, and margins.
Review the decision alongside cash-flow forecasts, debt obligations, and available capital. A capacity gap may be real, but a large purchase is not always the right answer. Scheduling changes, preventive maintenance, or targeted process improvements may address the issue with less financial risk. For decisions that affect several parts of the business, PCG’s capital planning and operational support can help leaders assess financial needs alongside execution priorities.
Assign clear ownership and coordinate planning through implementation
A capacity plan needs named owners, decision dates, and clear measures of progress. Bring production, sales, finance, procurement, and human resources into the process so order commitments, material availability, staffing, and cash needs align. Each team should know what it needs to provide, which decisions it owns, and when to raise an issue.
Carry the plan through implementation with a shared action schedule and regular check-ins. Track blockers and confirm that each change delivers the intended result. If you add a shift, for example, monitor training, attendance, output, quality, and labor costs. The start date is only one milestone. PCG’s coordinated approach connects business assessment with execution, helping leaders keep operational and financial decisions aligned.
Related Articles
- How We Help | Private Capital Group
- Our Approach | Private Capital Group
- Navigate Financial, Operational, and Market Pressure
Frequently Asked Questions
How can I tell whether a production delay is a bottleneck or a one-time issue?
Look for the same production step causing queues, missed schedules, or reduced output across multiple shifts or runs. A single breakdown or late material delivery may be temporary. Compare production records over time and check them with operators and supervisors before deciding where to act.
Which capacity measures should I review first?
Start with throughput, cycle time, downtime, work in progress, lead time, and defects. Review them together and by workstation, product, or shift. This can show whether a busy station is actually limiting finished output or whether another issue is slowing production.
Does higher equipment utilization always mean better capacity?
No. High utilization can coincide with growing queues, longer lead times, or more defects. Measure completed, quality-approved products as well as machine activity, and leave room for maintenance and planned production tasks.
When should I consider buying equipment or outsourcing production?
Consider these options when a recurring capacity gap remains after you review scheduling, maintenance, staffing, and process improvements. Compare costs, lead times, quality requirements, and the effect on cash flow before committing. Also check whether added capacity could move the constraint to another production step.
How often should we update our capacity plan?
Review it regularly, and whenever orders, product mix, staffing, or supplier timelines change. The right schedule depends on how quickly your business can adjust. Assign owners to actions and set dates to check whether changes are improving output without creating new costs or delays.